
New software supports vibration tests with non-Gaussian distribution
Body, chassis and the interior of vehicles are constantly exposed to dynamic stress. The performance and stiffness of the components are tested in product tests and simulated transport situations under real-life conditions. So far, the tests frequently were performed with noise excitation for which the normal Gaussian distribution was applied for the amplitude frequency. Now IMV vibration exciters can also be used for non-Gaussian vibration tests. This is made possible by new software which in addition to the conventional features for the traditional noise excitation includes two new parameters: kurtosis (“peakedness“) and skewness.
Real peaks are often higher
“The purpose of the non-Gaussian method is to adapt the signals used for excitation in the lab to real-life conditions as much as possible in order to obtain identical stress”, Dipl.-Ing. (FH) Martin Engelke, Marketing and Sales Manager IMV, says. It goes without saying that the test results depend strongly on the type and method of the mechanical stress produced in the lab environment. “Measurements during vehicle tests have shown that, in practice, peak vibrations are often higher and the frequency of the amplitudes follows a different distribution“, Engelke adds.
Non-Gaussian distribution supplies more realistic picture
Formerly, sine signals were often used. In the last few years, noise excitation has made ever deeper inroads in the realm of vibration testing because it provides a truer picture of the real stress. The noise excitation is based on normal distribution. For some time now, the non-Gaussian distribution has been preferred. It is important that the test engineer has a good understanding of the nature of the signals. He must take the protection of the test specimen from extreme peaks and the protection of the vibration testing system into account as much as the properties of the non-Gaussian amplitude distribution. In contrast with the uniquely described noise excitation with normal distribution (se, e.g., DIN EN 60068-2-64), these properties are more varied.
Two indices define the properties of tests with traditional noise excitation:
- The power spectral density (PSD) in (m/s²)²/Hz or g²/Hz, and
- The root mean square
Tests with non-Gaussian distribution require two additional parameters:
- Kurtosis (“peakedness“), and
- Skewness.
Both values are specified as integers.
Probability density function
The amplitude probability density function shows the distribution of the noise (or “accidental“) vibrations by which the properties of the signal can be evaluated. The diagram below shows the waveform across time rotated by 90 degrees and the amplitude values on the horizontal axis. Then the horizontal axis is divided in fixed intervals (bins). The histogram shows the number of points for each interval.
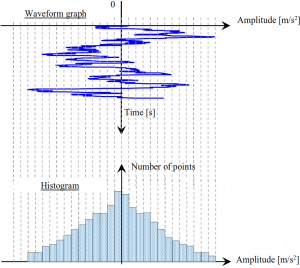
The histograms cannot be compared with each other because the number of points depends on the length of the time signal, i.e., the number of values becomes larger with longer time signals. For the amplitude probability density function, the histogram is normalised according to the total number of points. In this way, the amplitude probability density facilitates the comparison of different histograms.
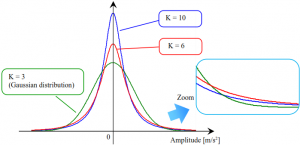
Kurtosis, measure of the amplitude probability density
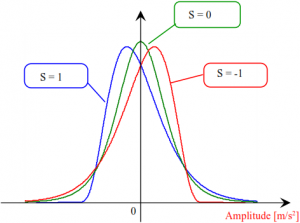
The kurtosis (“peakedness“) parameter is a measure of the amplitude probability density in the range of zero (i.e., the mean, in this case). Kurtosis of the Gaussian distribution is “3“. For higher values of kurtosis the probability density in the range of zero and also along the margins is becoming larger. Given below is an example of the amplitude probability density for different values of kurtosis.
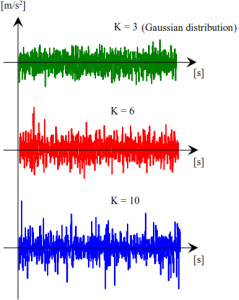
Examples of the time response of the signals with Gaussian distribution and kurtosis = 6 and = 10 are shown in the following graph. The higher the kurtosis, the higher the signal peak.
Skewness, a measure of symmetry
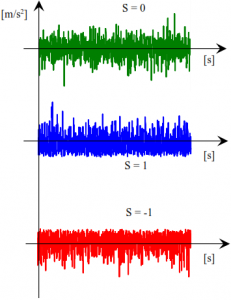
Skewness is a measure for the symmetry of the amplitude probability density. At skewness “0“, the distribution is symmetrical relative to the mean. At values other than zero, the amplitude probability density is skewed.
Examples of the time response of the signals with different skewness are shown in the following graph.
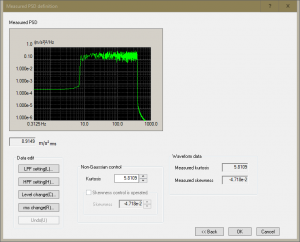
Control Like with traditional noise, as far as the control of non-Gaussian signals is concerned, the power spectral density (PSD) and the root mean square are controlled so that these values of the control channel agree with the reference values. The values of kurtosis and skewness are controlled, in addition. Therefore, in a noise test with non-Gaussian excitation, the root man square and the power spectral density are the same as the values for tests with Gaussian distribution, the peaks in the time response of the signal are higher, however.
For the exact mapping of the non-Gaussian signals, the control of the time response of the signal was introduced. Before the test starts, the transfer function of the system must be determined:
- Measurement of the transfer function
- Adjustment During the first adjustment, the power spectral density and the root mean square are matched with the set points.
- Adjustment for non-Gaussian distribution Now the values for “kurtosis“ and “skewness“ are matched with the set points.
- Test starts
Sporadic and stationary peaks
Even when kurtosis and skewness are specified, the time response of the noise signal is not defined sufficiently. Another differentiation is possible.
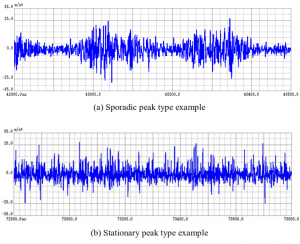
- Sporadic peak type In this case, peaks occur sporadically; only a value for kurtosis can be specified for this type of excitation.
- Stationary peak type In this case, peaks occur constantly; values for kurtosis and skewness can be specified for this type of excitation.
Examples of the time response of the signals for different characteristics are shown below.
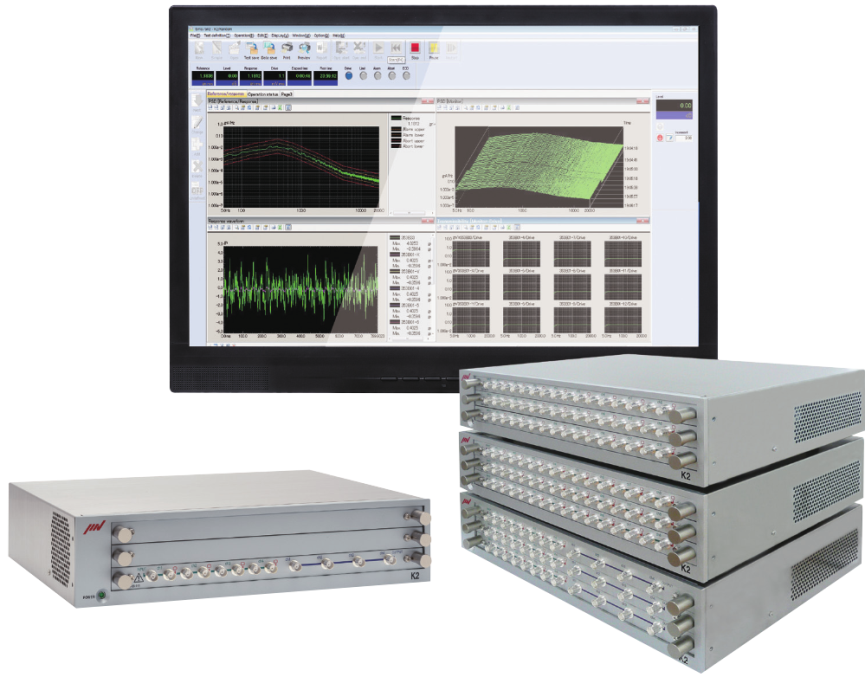
Vibration testing systems from IMV
The IMV vibration controller type K2 and the IMV vibration testing systems support tests with non-Gaussian normal distribution. This new method provides an even better representation of real-life situations and the test results are more accurate. The values and characteristics described above can be used for these tests.
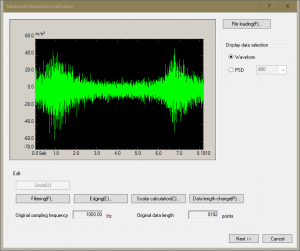
In addition to this, it is possible to analyse acceleration-time data to obtain the parameters for describing the signal. This permits the user, e.g., to increase the root mean square of signals for time compression.

IMV Europe For over 55 years, the IMV Corporation has been making valuable contributions for improving our environment. The company, based in Osaka, Japan, is the global leader in single-axis and multiple-axis vibration testing systems with annual sales exceeding 60 million Euro and branches in all parts of the world. Since 2011, IMV has successfully marketed test solutions also in Germany, Austria and Switzerland through IMV Europe Ltd.
IMV provides most advanced technology with the ECO factor: These systems save energy and the reduce the release of CO2 dramatically because fan, speed and field supply can be controlled as functions of the load. Vibration testing systems with a green thumb! Service and customer satisfaction have always come first with IMV. The company cooperates closely with experienced service technicians who take care of a technical solution quickly, with competence and reliability. More information at www.imv-tec.com/de.
Contact with IMV Europe Ltd.:
Martin Engelke, Dipl.-Ing. (FH) Marketing and Sales Manager Landsberger Str. 406 81241 Munich, Germany
Press contact:
Susanne Engelke M.A. PRESSE | PR | ONLINE Mobil 0049 151 11652587 info@susanneengelke.de